Dummies Guide to modelling a Covid-19 Rollout: Part 2.

The first stage of the model showed a population of 5 million receiving a two-dose vaccine over two years with priority going to administering the first dose. 

The model showed that after two years, 4.65 million people were vaccinated and 340,000 remained unvaccinated. The vaccination uptake was 20% of the unvaccinated population receiving their first jab each month and becoming available for the second within two months.

The second iteration of the model shows an outbreak of Covid-19 in the first month of the rollout. It sent shockwaves through the population and the vaccination rate roses from 20% to 50%.

Graphical user interface, chart, line chart

Description automatically generated

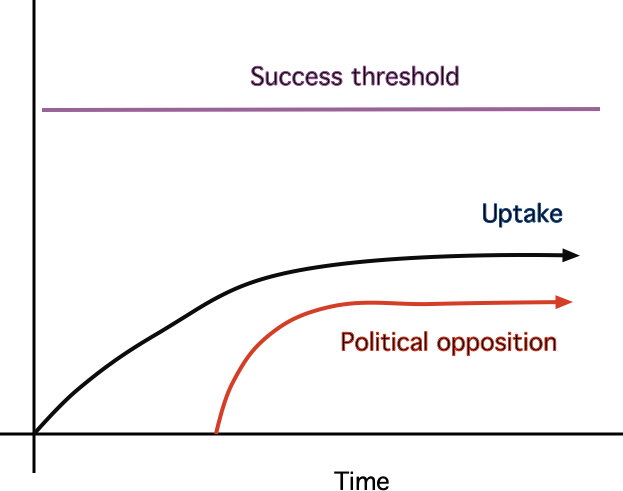
The graph on the right shows the progress without shock. It takes two years before the population reaches 4.6m vaccinated people. That is 92% and most people would be happy that with that outcome, even if it did take two years.

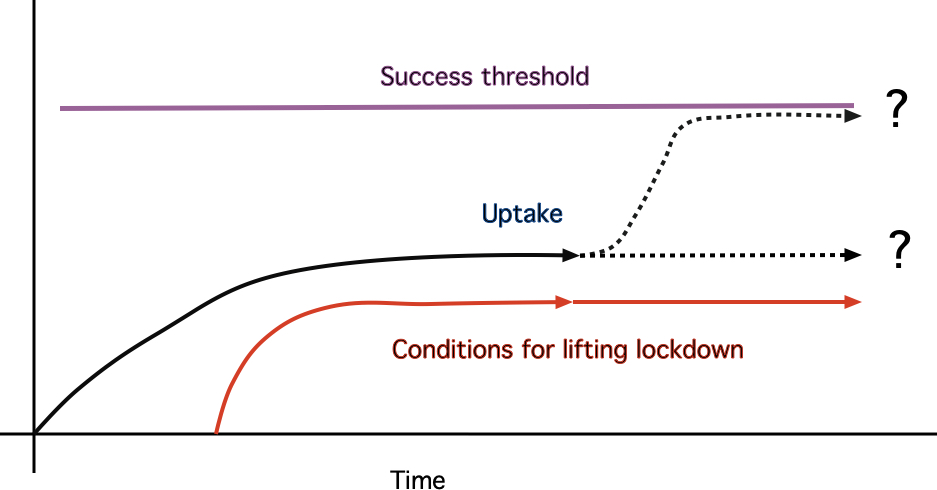
The right-hand graph shows the impact of a Covid outbreak, which shakes the population out of its complacency. First, notice the early jump in the population with one jab (blue line). This results in a rapid fall in the unvaccinated population and a rapid rise in the population with two jabs.

The residual vaccinated population in the left-hand graph is almost certainly more realistic. However, experience in Australia shows that vaccination rates are increasing as a result of Covid infections and lockdowns.

Then everything goes pear-shaped.

Early clinical information about the government’s preferred vaccine indicates risks of blood clotting in certain age groups. The chances are low, but several countries, which have secure supplies of other vaccines, call a halt to the administration of the only vaccine the Australian government has access to.

Health Authorities recommend that the vaccine should not be used for people under 60 until new advice is received on the risks of blood clotting. The take-up rate of the vaccine drops from 30% to 5%. Worldwide demand means no new vaccine supply will be available within 12 months.

Projections indicate that the rollout will be stalled for the next 24 months, with only those prepared to accept the low risk of blood clotting being vaccinated. 

Chart, line chart

Description automatically generated

After 24 months, modelling suggests that roughly half the population will be fully vaccinated if the health authorities do not clear the current vaccine.

After 12 months, the government is able to secure supplies of a new vaccine, which does not have the associated clotting risks. Once that becomes available, vaccine hesitancy appears to have been overcome.

Chart, line chart

Description automatically generated

The impact of the population with one jab can now be seen. As first movers, they were influential in getting people vaccinated, but the news of the problems with blood clotting slowed vaccination rates. When a new vaccine arrived shortly after 16 months, vaccination rates jumped again.

Under all scenarios in this model, the population is vaccinated within two years.

There are some assumptions in this model that may not be true in the real world. These can be simulated in the model.

It is possible to model scenarios where there are supply shortages and logistics problems.

The big elephant in the room is what will happen while it takes two years to reach 80% vaccination.

Dummies Guide to Covid Rollout Part 1

We often hear reference to modelling done in universities or research centres. This modelling is important because it is the basis of important policy decisions.

This is a Dummies Guide to help the curious understand one of the more simple methods used to build these models. The model has a simple set of images that represent the computer code that drives the model. It is a computer simulation model using System Dynamics. 

The model is of an Australian state with an adult population of 5 million people. The vaccine is a two-dose vaccine. The government is ordered 500,000 doses each month for two years and prioritised the first dose.

To start, it helps to think of a series of bathtubs filled by a series of pipes which are controlled by a series of taps. Each series of bathtubs contains stuff: in our case: people and vaccines,

The Dummies Guide model for a vaccine rollout using this system would start out looking like this. The members of the unvaccinated population receive their first jab and move on to the population with a first jab. Some remain behind in the unvaccinated population. Members of the Population was 1 Jab receive a second jab and move on to the population with two Jabs.

Box and whisker chart

Description automatically generated with medium confidence

The Unvaccinated Population flows into the population with 1 Jab through the flow entitled First Jab. The same dynamic applies to the population with the Second jab.  

This is possible because of another associated Co-flow. There Is a supply of Vaccines. They accumulate in a warehouse or vaccination hub according to the demand generated by the first and second jabs.. 

Diagram

Description automatically generated

The government endeavours to match the supply of vaccine with the anticipated demand. But they are also constrained by the amount that they can order from overseas. So they decided to order 500,000 doses per month.

Diagram

Description automatically generated

There is now a dynamic interaction between three populations and the stock vaccine. The Unvaccinated Population generates a demand for a 1st Jab. Not all of the Unvaccinated Population will want to get vaccinated and some may wait to get vaccinated.

Chart, line chart

Description automatically generated

The unvaccinated population declines over time, while the population with two jabs increases. The population with one jab increases but at a declining rate over time. This is because people are just passing through this population on their way to the population with two jabs. The numbers are smaller over time because the unvaccinated population is declining.

After two years there is still a residual unvaccinated population.

The government priority was for first jabs. This meant there was no waiting for the first jab, but it took fully two years before the second jab was delivered to the total population. 

Chart, line chart

Description automatically generated

The full model generated this data is very simple. The next stage will be to model the impact of an outbreak of the virus and a lockdown.

The dynamics of blood donor appeals are counterintuitive

The ARCBS is appealing for blood donations. They need 22,000 in the next fortnight.

Three things are going to happen. 

People who are already blood donors will bring forward their donation appointment. Potentially, this means there will be a shortfall sometime in the future.

New donors will donate for the first time.

Lapsed donors, who have not donated for sometime will begin debating again.

The difficulty was donors is that of first-time donors only one in four goes on to donate regularly. This makes increasing the database extremely time-consuming and expensive

These dynamics of the donor appeals and increases in demand over time. The outcomes are counterintuitive

To demonstrate this, the first two slides things between the flows of donations and usage and accumulation of reserves stock.

In a normal equilibrium state, reserve stocks will be slightly higher than daily demand.

The first warning sign is a temporary drop in donations 

This leads to a decline in the reserve stock often below safety levels

It can lead to disastrous consequences if it happens twice.

The obvious solution is to have an appeal to donors and potential donors. These are usually successful.

The prblem is that the appeal pulls forward future donations leaving a shortfall in the future when donations and preserve stock decline again.

All of these dynamics are on the supply side. Sometimes there are events which can increase demand.

The difficult situation arises when there is a decline in donations and an increase in demand.

Recidivism in Victoria

MODELLING SHOWS VICTORIAN RECIDIVISM RATES SLIGHTLY UNDER 60%

Here’s how the model works. I will do a separate post on the actual numbers.

That means 60% of prisoners wind up back in gaol. So if one of the aims of the prison system is rehabilitation then it is failing miserably.

Prisoners come out of prison into the community. We know that 43.7% of prisoners returned to prison within two years of release having reoffended. 

This actually means that 28% return after one year and 24% return after two years. But, prisoners continue reoffending in subsequent years. Statistically, this means 19%, 15% and 12% reoffend in the next three years. After the numbers are relatively inconsequential.

System Dynamics is very good at modelling this sort of problem. This is what the model looks like. 

Let’s assume that 100 prisoners were released flow into the conveyor on the right-hand side. 

Total releasedYear 1Year 2Year 3Year 4Year 5
1007255453833

Numbers who remain in the community

Year 1Year 2Year 3Year 4Year 5
No of Recidivists18171075

Number re-offending each year

The graph of the recidivist numbers suggests the modelling is conservative. However, this comes with a caution that is probably justified. 

The original 43.7% that the modelling is based on is based on empirical evidence and the modelling is based on statistical projections.

The causes of recidivism are deeply entrenched in the society into which the prisoners are released and are difficult to eradicate. However, with some prisons returning as many as 11 times, recidivism is a profound problem for the Victorian system and without finding some solution the numbers in Victorian prisons will continue to escalate.

Victoria’s growing prison population

Victoria’s prison population has almostdoubled over the last decade.

It is gone from 4500 to just under 9000. The prison population is growing faster than the general adult population which increased by 24% over this period. 

The rate of imprisonment has increased from 62 prisoners per 100,000 Victorian adults in 2000 to 118 per 100,000 in 2018, an increase of 90%.

The Andrews Government has earmarked $1.8 billion in the budget for capital spending on prisons, the centrepiece of which is a  new 1248-bed prison planned for outside Geelong. The Andrews government expects prisoner numbers to soar from 8110 today to 11,130 by June 2022. 

If prison numbers continue growing at the current rate, there are some implications for prison capacity in the next decade.

Modelling indicates that if prison numbers continue to rise as they have over the last decade they will reach 16,000 by 2030. Prison capacity is scheduled to rise to 12,800 by 2022. The modelling indicates that prison capacity will be reached by 2027.

This will leave the shortfall of 2800 by the end of the decade.

That’s two new prisons, both bigger than the $1.8 billion one planned for 2022. And both bigger than Victoria’s current largest prison, Ravenhall.

It’s probably time for a rethink of justice policy in Victoria.

Victoria may need three new prisons in the next decade

The Victorian prisoner population has grown by over 160% in last decade with 35 per cent of prisoners now on remand.[1] The prison population is growing faster than the general adult population which increased by 24% over this period. (Source: Corrections Victoria’s Annual Prisoner Statistics). 

The rate of imprisonment has increased from 62 prisoners per 100,000 Victorian adults in 2000 to 118 per 100,000 in 2018, an increase of 90%.

The Andrews government expects prisoner numbers to soar from 8110 today to 11,130 by June 2022.  

The current capacity of the Victorian prison system is 8900.[2]

Currently, it is planned to increase prison capacity by 3700 by 2022. This will bring the total planned capacity to 12,600[3].

When the planned capacity for 2020 is compared to the modelled prediction of prisoner numbers by 2030 based on current growth rates, it can be seen that the new capacity limit will be reached in 2027. 


This will leave the shortfall of 3312 prison beds by 2030. 

Victoria’s largest prison, Ravenhall now has expanded its capacity to 1600 from its original 1300 through the use of double bunking. 

The projected increase will require the building of at least two new prisons with the planned capacity of that of Ravenhall .


[1] A. Freiberg and S. Ross, Sentencing Reform and Penal Change: The Victorian Experience (The Federation Press, 1999); Australian Bureau of Statistics, Australian Demographic Statistics, Dec 2018, Cat. No. 3101.0 (2019); Australian Bureau of Statistics, Prisoners in Australia, 2018, Cat. No. 4517.0 (2018).

[2] https://www.theage.com.au/national/victoria/prisons-are-booming-as-victoria-pays-for-its-tough-on-crime-stance-20190627-p5220f.html

[3]https://en.wikipedia.org/wiki/List_of_prisons_in_Australia#Victoria


EDIT

The problems of the Covid-19 tracing App.

Scott Morrison’s push for Australians to download the Covid-19 App appears to be meeting with mixed success. There are a couple of reasons for this.

Firstly, so far 4 million people have downloaded the App. 

The government claims that, with this level of compliance, it’s approaching the threshold 40% for the App to be effective. 

It is difficult to assess whether this is correct.

There are 18 million mobile phones in Australia. There will also be multiple phone per person. So, it’s difficult to assess what level of take-up is necessary. Four million is only just over 20% of 18 million. So, it really depends how you count: total number of phones or total number of people with phones.

If someone has more than one phone, they really need to download it onto all of their phones.

 Secondly, there is not universal support for downloading the application.

A range of concerns have led to some high profile people not downloading the App.

One is Independent Federal MP Andrew Wilkie.

Wilkie, who has worked for the  Office of National Assessments (ONA) and was a Lieutenant Colonel in the Australian Army, has stated

“it is not my intention to use the Federal government’s pandemic phone app until I’m convinced it’s effective and secure. Until then I remain unconvinced that the likely low uptake rate in the community will achieve anything other than give people a false sense of safety and encourage them to drop the personal health precautions

In addition, I don’t trust to government implement, manage and safeguard the system without risk of leaks or hacks or to limit the use of the system to the pandemic.”

John Roskam, who heads the Institute of Public Affairs think tank, which is influential with many Liberal MPs, said the app was “very bad and very dangerous”.

“There is no way the government or any technology company can be trusted with that information, and guarantees the government gives are worthless,” he said. “It is authoritarian and goes against everything the Liberal Party stands for, and it is incredible it is even being considered.”

Independent MP Zali Steggall tweeted that a “lack of trust in, and transparency by, government is a major hurdle to people accepting [the] contract tracing app”.

Barnaby Joyce has also refused however this may not have been an influential decision.

Morrison has also unwittingly established a systemic problem for himself. The concern about security, the trustworthiness of governments, the lack of transparency over the source code and the effectiveness of the application itself may have the impact of stalling the number of applications downloaded. 

The dilemma is highlighted in a paper by behavioural economist Christian Thöni of the University of Lausanne: The majority — about 60 per cent — are “conditional cooperators”. They cooperate if they believe others will cooperate.

A rapid uptake of the App would have created what is known as a “Success to the Successful” structure, where the number of people downloading encourages others, the conditional cooperators, to do so.

Unfortunately, if this does not happen then the result will be a “Failure to the Failing” structure. With the low numbers of people downloading encouraging others not to download.

This Causal Loop Diagram shows how this dynamic is established.*

The problem for Morrison is that, unless the initial download momentum is strong enough to convince the conditional cooperators, he will not get the numbers necessary for the application to be successful.

Making the success of the Covid-19 App a condition for easing the conditions of the lockdown may be sufficient to reverse the negative effects of the left-hand side of the CLD.

But if it isn’t, then Morrison will effectively be punishing the people who have complied with the government’s wishes and that could cost him significant political capital.

* An “S” end of the arrow means that the variables move in the same direction: if the first goes up the second goes up, if the first goes down, the second goes down. An “O” means the variables move in the opposite direction.

Modelling policy leverage points in the Victorian prison system.

This blog is a continuation of an earlier blog entitled

VICTORIAN GOVERNMENT MAY HAVE OVERESTIMATED THE 2023 PRISON POPULATION IN THEIR PLANNING

In this blog, I discussed how Victoria’s prison population has increased by 80% in the last decade, primarily as a result of a “tough on crime” approach by both sides of politics

This is a simple system dynamics model of the prison population used in that blog.

System dynamics models such as this one allow decision-makers to vary certain policy levers and understand how the system functions over a given time as a result of those changes.

The model produced two sets of data which indicated that the government may have overestimated prison numbers.

The projection of rates of Incarceration, Release and Recidivism.

The projection of the prison population to 2023..

While this simple model yields some insights into the problem, it provides no insight into the potential policy leverage points in the system. To do this requires simulation with a larger and more sophisticated model.

This simulation models the individual courts (Supreme, County, Magistrates) and their outputs.

It would also model people being held in remand awaiting trial. This element of the model is extremely important as, according to the Victorian Ombudsman, they represent 50% of the prison population. In addition 50% of this group is not convicted despite having been held in remand.

The model would also capture the feedback effect of recidivism which is particularly important with the rising prison populations.

The model of the Prison Sector would include length of incarceration for each one of Victoria’s prisons.

This would also model the impact of variations in release rates, such as early release as result of rehabilitation programs, from various Victorian prisons.

The power of such a model is that it allows decision-makers to identify and evaluate policy delivery points. Policy delivery points are located in the flows in and out of the stocks.

The following diagram indicates a set of policy levers relating to remand and diversion programs.

In this case the policy levers are

1 the rate at which bail is granted or not granted,

2 the rate at which individuals are put into diversion programs and

3 the rate at which they complete these programs

Each one of these can be varied in the model and the impact of the variation on the total system evaluated.

A separate model could also be developed to simulate the financial implications of the variations in the court and prison models.

Victorian government may have overestimated the 2023 prison population in their planning

Victoria’s prison population has increased by 80% in the last decade, primarily as a result of a “tough on crime” approach by both sides of politics

The annual cost of running the state’s prisons is now more than $1.6 billion, triple the outlay in 2009-2010. As well, the government announced a record $1.8 billion in new capital spending on prison infrastructure over four years in a bid to accommodate 1600 more prisoners.

Projections released exclusively to The Age reveal that the growth will continue into the foreseeable future: the Andrews government expects prisoner numbers to soar from 8110 today to 11,130 by June 2023.

This is a simple system dynamics model of the prison population

From published figures is possible to model the rates of prison release, recidivism and first offender incarcerations up until 2019 and then project for the next four years until 2023.

The model has a number of assumptions: that the recidivism rate will be 43% after two years, that the average stay in jail is slightly over one year and that incarceration rates will be linear based on 2008 – 2019 figures. Release and recidivism rates rise in line with the increase of incarceration.

The difficulty with this linear projection is that it shows no sign of flattening. It is reasonable to assume that sometime in the future incarceration rates will plateau. When is a question.

Given these assumptions and these increasing rates of incarceration, The model shows the growth in the gaol population.

The projection for the prison population in 2023 is 9600, 15% below the government’s estimate of 11,130.

For the prison population to reach the government’s estimated total, there would need to be an increase in incarceration rates, recidivism rates or sentence length.

At present, there is nothing to suggest that these rates will change.

However, the government plans to increase the number of beds in prisons by 1600 over the next four years. This will take prison capacity in Victoria to 9700, just 100 above the total projected in the model.