Background
Projects have been going wrong from time immemorial. According to some sources, construction on the tower of Babel was halted because the builders weren’t able to communicate with each other

By 2019, the cost of Sydney’s troubled light rail line had surged from $1.6b to $2.7b due to poor pricing, omissions in the business case, legal fees and payments for damages.
When projects go wrong, they go wrong for many complex, but often interrelated reasons. And when they go wrong, it inevitably leads to immense and costly delays
Managing a project can be like running a sports day where everyone turns up with different equipment: cricket bats, basketballs, footballs, scuba gear, bows and arrows and lawn bowls.
Everyone is good at what they do, it’s just that they’re not all doing the same thing.
A similar difficulty exists with projects. Diverse stakeholders will have different perceptions about the objectives of the project and often approach it from quite different perspectives.
Linchpin Systems’ approach is designed to give everybody the same equipment and the same view of the playing field before the game starts.
Linchpin Systems’ approach
This approach is based on five assumptions.
- Stakeholder groups are unlikely to understand, or be aware of, the significantly diverse assumptions of other stakeholders.
- Establishing shared understandings, agreements and networks between stakeholders early in a project’s life can lead to reductions in time and cost overruns.
- There needs to be a common language for understanding the structure and dynamics of the project. The tools and techniques of Systems Thinking provide this common language.
- Establishing an ongoing stakeholder network can provide a mechanism for monitoring and flagging potential problems in a project.
- All projects exist within a broad social, organisational or political context and the success of the project rests upon the recognition of the constraints and dynamics of this context.
The Aim of the Program
To create, for clients with significant responsibilities for major projects, a network of key stakeholders with a common understanding and a common language for dealing with the complex dynamics and wicked problems of the project.
The program seeks to answer the question “Is it possible to create a community of interest made up of project stakeholders that will be capable of improving the performance of the project in a way that individual stakeholders would not be able to?”
The Process
- The client identifies the major stakeholder groups.
- The client then establishes groups within their organisation which will represent each of these stakeholder groups.
- Each of the stakeholder groups will be invited to send representatives, who have significant decision-making authority, to a series of workshops with the representative groups.
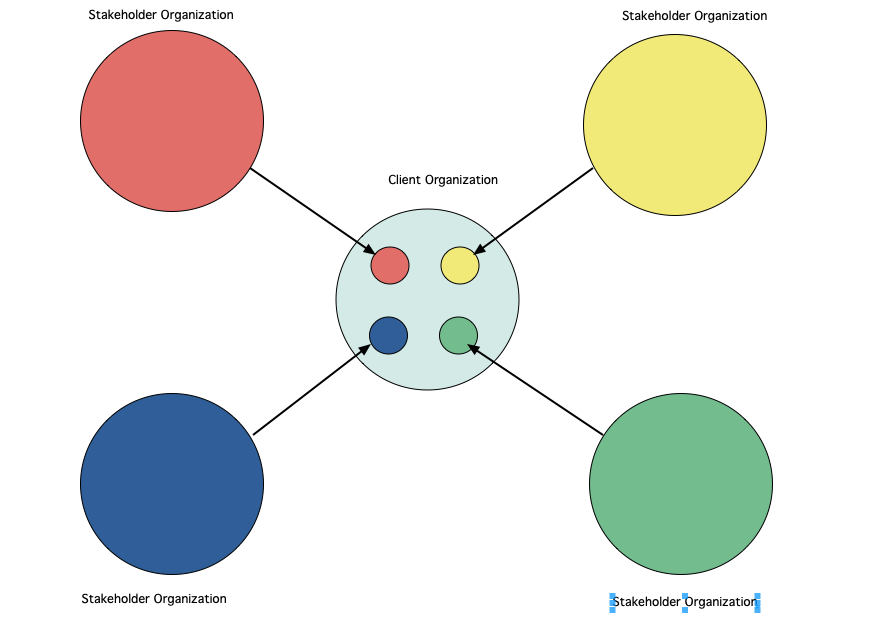
- These workshops will use a range Systems Thinking tools and techniques to develop a stakeholder network capable of providing advice back to their parent organisations.
- These workshops should be ongoing and be used to monitor issues that arise during the project.
Systems Thinking Tools and Techniques
The great strengths of the tools and techniques of Systems Thinking is that they provide a common vocabulary and means of analysis for projects, social systems and organisations.
Two major techniques are used in the program.
Soft Systems Methodology which uses Rich Pictures and CATWOE and is a good “entry level” start to Systems Thinking.
There is also a very good description of the broader context of Systems methodology which Checkland developed here and an example of a Rich Picture here.
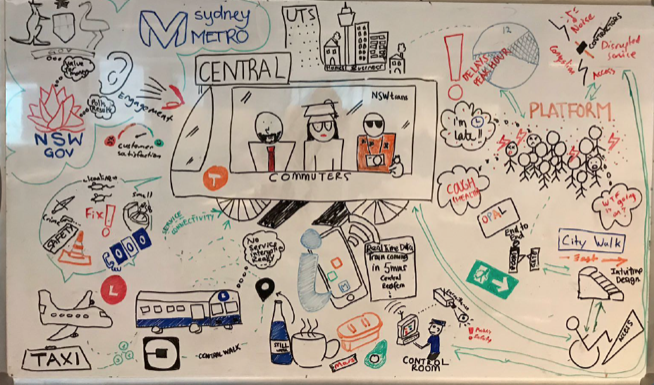
In the workshop, each stakeholder group will produce a rich picture that represents their view of the project. They are encouraged to include all major elements of the view and to show the interconnections.
When the rich pictures are completed, the groups circulate while one member of each group takes turns to explain the picture.
As a result of this process, the members of the client group and the representatives of the stakeholder groups all have an understanding of the perspectives of all of the stakeholders.
They have also taken the first steps in developing and understanding of the causal interactions and structures that will influence the project.
Causal Loop Diagrams (CLDs)
CLDs represent a step up the sophistication of Systems Thinking because they identify four key concepts central to understanding how systems work.
- Behaviour over time
- Causation
- Structure
- Feedback
The first stage in constructing a CLD is to identify the dynamic behaviour of a key variable in a behaviour over time graph.
A useful example is the congestion that is developing on tram stations in inner city Melbourne. This is the the behaviour over time graph (BOT) of congestion at tram stations which was regarded as a significant and developing problem.
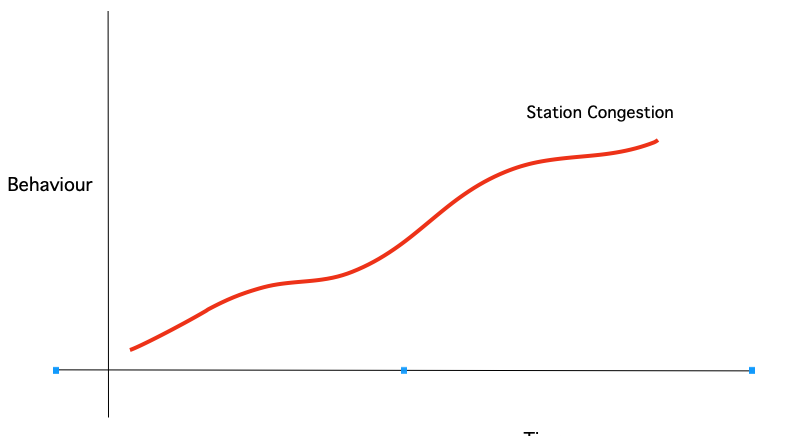
Notice that the congestion does not rise consistently. Sometimes it flattens out. This is because there are upgrades to the stations in response to public demand, .
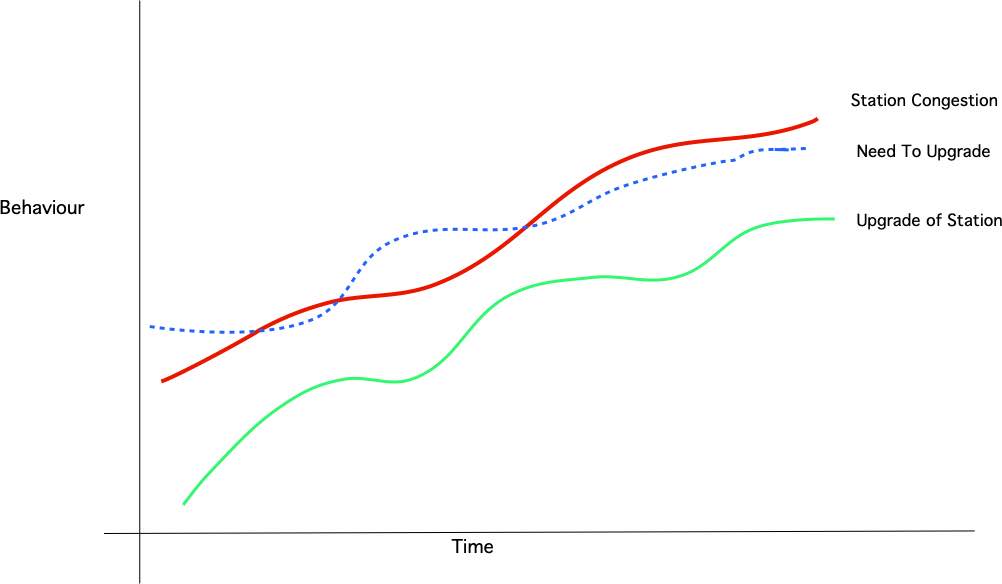
The second stage is to identify variables that drive the dynamic behaviour and then what dynamic behaviour that variable produces.
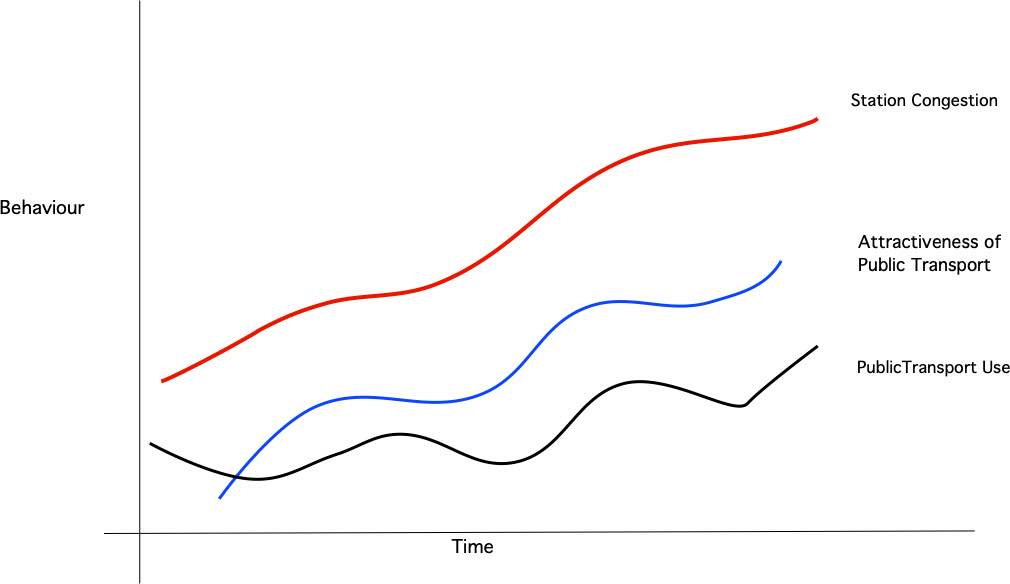
As a result, both the attractiveness of public transport and public transport use have oscillated around the rate at which tram stations are upgraded.
Now it is possible to construct a CLD and a complete behaviour over time graph. You can find a description on how to read a CLD here
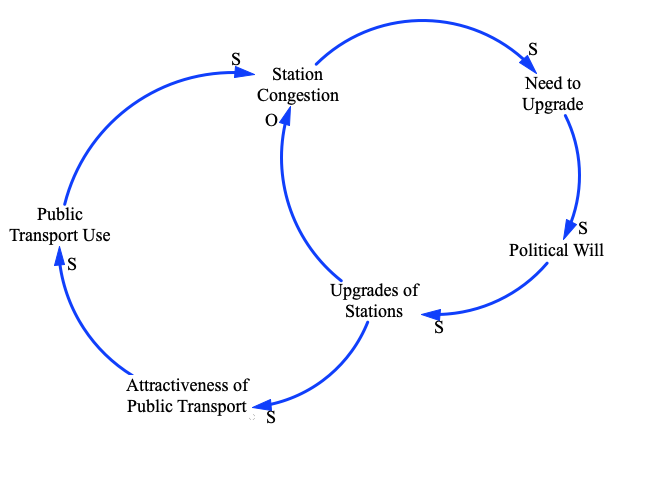
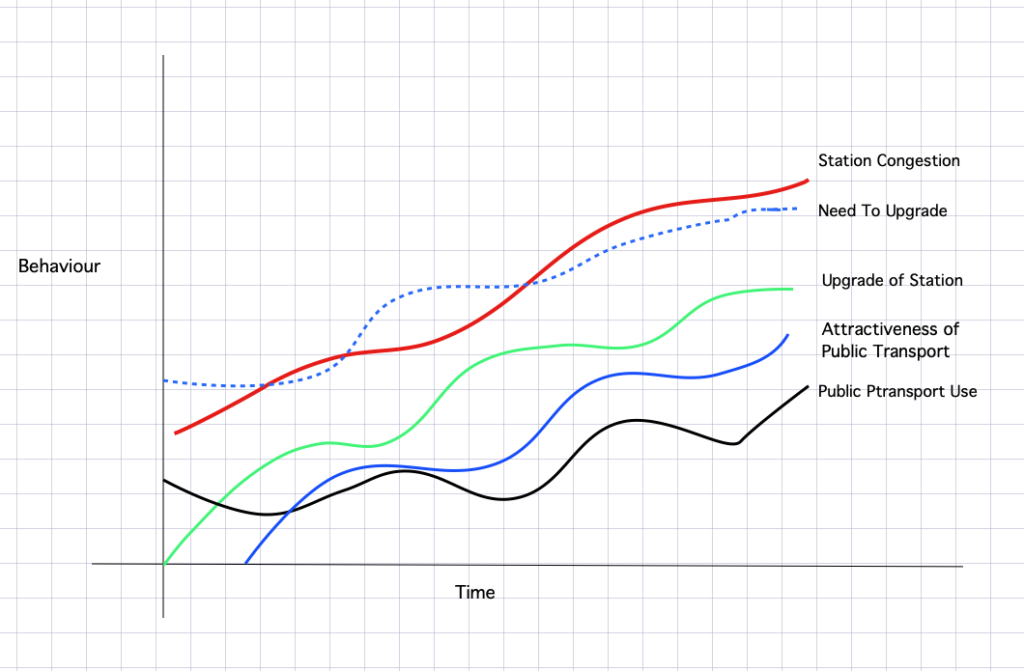
These simple and elegant diagrams can establish a common understanding of the structure and dynamics of policies surrounding major projects. They also raise questions about the efficacy of upgrading existing structures to deal with ongoing problems.
This CLD also demonstrates two important elements of Systems Thinking
Policy is often counterintuitive. This particular policy is also seen in the construction of freeways: that improving the system to reduce congestion increases usage which in turn creates more congestion.
Behaviour is endogenous. While the station upgrades solve the problem in the short-term, the long-term effect is to exacerbated it. Because, the structure of the system produces its own behaviour, changing the behaviour of a system will involve changing its structure.
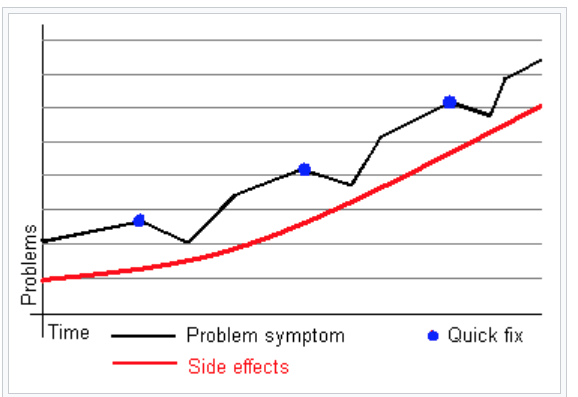
This system also demonstrates the classic behaviour of one of the classic Systems Archetypes “Fixes that Fail” where dealing with the symptoms of the problem, namely congestion, does not deal with the underlying problem which is the rising population in the inner city and the inability of the tram network to cope with the extra load.
As with the rich pictures, when the CLDs and the BOT graphs are completed, the groups circulate while one member of each group takes turns to explain them.
Final Activity The Town Hall Meeting
Town Hall meetings are a place where communities come together to discuss issues that are of importance to them. All of the stakeholder groups will present their two or three most important issues to the meeting. They will then be open to questions and discussion. At the end of the meeting, there is a voting system that prioritises the top three or four issues for the total community.
The meeting will also be open to members of the sponsoring organisations.
Background Activity
The client organisation would be encouraged to create a website where the Rich Pictures and CLDs could be posted and where the results from the Town Hall meeting would also be posted.
There should also be room for discussion forum which all members of participating organisations could have access to.
I